Youngstown 2010 Plan
Chapter 4: Citywide Conditions
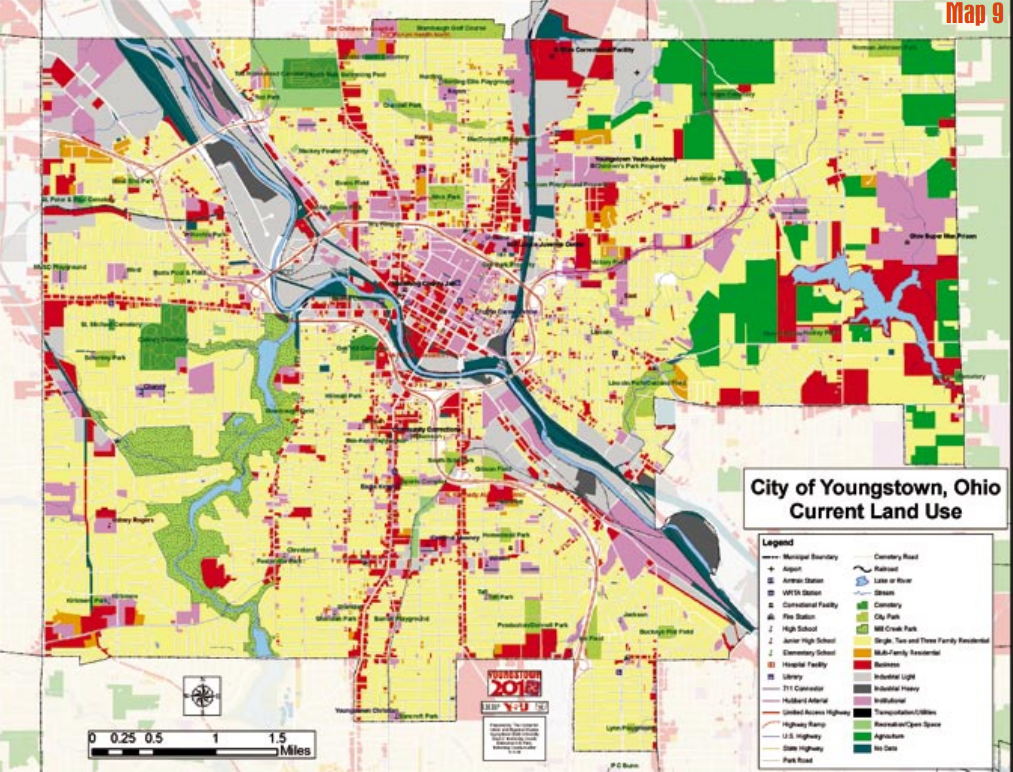
The reality that became Youngstown after the 1951 & 1974 plans only slightly resembles the intentions of the planners. The current land use (see Map 9) shows prescribed uses peppered with widespread non conforming uses. It demonstrates far too much commercial, industrial and residential use for a city of 82,000. The current land use shows the need to plan for the new reality of a smaller city.
Population
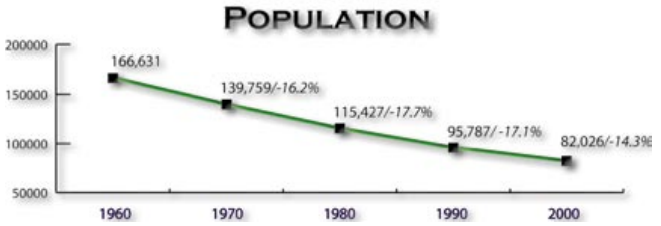
The City of Youngstown has experienced an average of 16% population decline every ten years for the past 40 years and has lost over half its total population. It is anticipated that this trend will slow and the population will stabilize.
Race
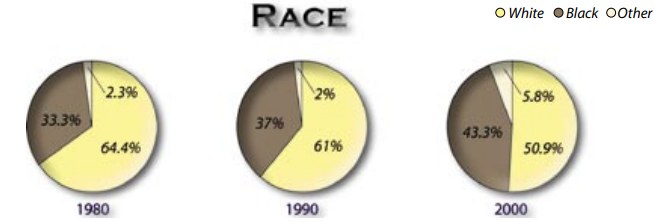
The racial make up the City has changed over time as well. Twenty years ago 64% of the population was white and by 2000, it was just over 50%. The city had become racially balanced.
Age
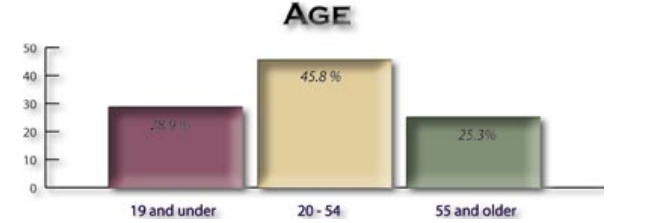
The majority of the population of the city in 2000 was between 20 and 54 years old. An important factor to consider is that of the 25.3 % of the population over the age of 55 years old, 17.4 % were over the age of 65.
Housing
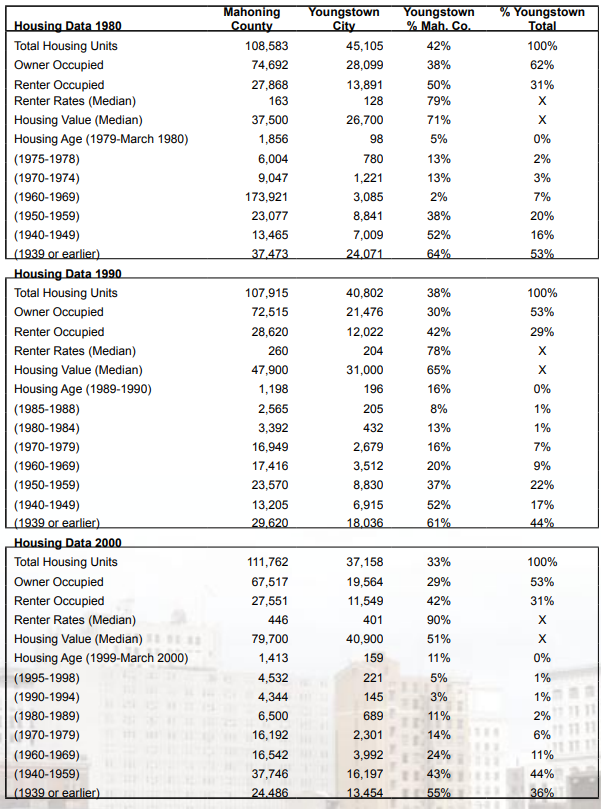
Between 1980 and 2000, census data indicates that the population has fallen from 115,423 to 82,026 and the number of housing units has fallen from 45,105 to 37,158. The drop in population experienced by the City of Youngstown has not been matched by a sufficient reduction in the housing stock. The 2000 census showed that the City has 3,325 excess housing units assuming 2.4 persons per household. This figure is over and above a generous 15% ‘normal’ vacancy rate.
Census data (see Table 1) also indicates that Mahoning County outside the City actually gained housing units between 1980 and 2000, more than offsetting the decline in the City. The statistics also indicate that the City’s housing stock is disproportionately old compared to the County’s. The vast majority of new construction has taken place in the suburbs since 1980; the majority of the City’s housing stock was constructed before 1950.
The City has not shared in the housing boom that continues to occur in the Mahoning Valley region. The “up and out” phenomenon that has
occurred nationally has been painfully evident in Youngstown. The region as a whole lost population during this time period, so there was no population pressure to support a new housing boom. The net result was that every new construction yielded a dwelling somewhere else in the region that was no longer economically viable. The majority of nonviable dwellings were in Youngstown.
The implications of this extra housing stock are readily apparent throughout the City. Structures that in effect have no economic value are abandoned and looted of anything that has scrap value, become convenient places for criminal activities and eventually deteriorate to the point where demolition is the only option. The impact on neighborhoods where concentrations of abandoned houses exist is catastrophic, leading to further disinvestment and abandonment.
The age of the housing stock, the lack of new market-rate construction and abandonment have left the City of Youngstown with housing values that lag behind those of the two counties and all suburbs. The 2000 census data (see Figure 1) shows that not one of Youngstown’s five planning districts has a median housing value that is equal to any suburban or county rate. More disconcerting is the fact that the City as a whole has a median housing value approximately half the Mahoning County median, and fares even worse compared to the other entities.
Disinvestment and Aging Housing Stock
Major problems associated with Youngstown’s aging housing stock other than the ravages of time are lead and asbestos. Much of the City’s housing is in need of remediation for lead paint (the oldest for lead plumbing) and asbestos. The negative health impacts of lead and asbestos not only limit resale potential but dramatically increase the cost of demolition and/or rehabilitation.
The spatial distribution of the median housing value of owner-occupied housing mirrors the patterns of the age of housing stock. In general, newer housing carries higher value. Th e postwar suburban-type development in the Kirkmere neighborhood on the southwest side illustrates this, as it has the City’s highest median value (see Map 11). Housing in the section of the North Heights neighborhood (along and west of Fifth Avenue and north of Crandall Park) also demonstrates high value despite being older stock. This area is a relatively stable section of the City’s historic upper income district. Th e City’s old core neighborhoods on the North (Brier Hill), South (Oak Hill, Warren, Erie, Lower Gibson) and East (Hazelton, East Side, sections of East High, and sections of Landsdowne) have housing values that show the ravages of time and disinvestment. These areas are the victims of neglect and abandonment.
Vacant and Abandoned Properties
The extent to which deindustrialization and suburbanization has impacted current conditions in the City is apparent in the amount of currently vacant land (see Map 13). The far east side contains vacant land that was never developed. The majority of the rest of the vacant land was formerly occupied by business, industry or housing.
The volume of vacant property is a double-edged sword for the City. It shows there is no shortage of available land, but it forces the City to make some hard choices. Not all infrastructure can be maintained and not all neighborhoods can return to their past sustainability.
Overlay Zoning
The purpose of an overlay zoning district is to provide an opportunity for appropriate, creative planned development and/ or redevelopment to occur within designated areas. Overlay zoning districts allow for more flexible use of land than does a more rigid zoning classification. Many factors determine the criteria and procedures for overlay zoning districts but the City will ultimately ensure the protection of public health, safety and welfare.
In the City’s current Planned Development Overlay zoning, the property owners within an overlay zoning district have the option of developing subject to the requirements of either the approved final development plan or the underlying zoning classification.
This resource is an abridged version of the Youngstown 2010 plan. You can access the full version in pdf format below.